
Six degrees of separation: a visualisation of which historical collections today’s libraries have in common
by Alfie Abdul-Rahman, Cristina Dondi, Binuli Markawitage, Jacelyne Tan, and Yiwen Xing
Share this article
Over the summer of 2026, Binuli Markawitage and Jacelyne Tan were part of the King’s College Undergraduate Fellow (KURF) program, in which they had the pleasure of working in a collaborative effort with Dr. Alfie Abdul-Rahman from King’s College London, Dr. Yiwen Xing from the University of Oxford, and Prof. Cristina Dondi from Sapienza University of Rome. Binuli and Jacelyne are truly grateful to have been a part of this multidisciplinary initiative spanning history and technology.
The internship is a continuation of Booktracker [https://booktracker.sites.er.kcl.ac.uk] an ongoing collaborative research project focusing on the design and development of visualization tools to assist historical book researchers. Built on the Material Evidence in Incunabula (MEI) database, an invaluable resource by CERL that contains information about the distribution, use, and survival of the first books printed in the 15th century (known as incunabula), this endeavour has resulted in a range of interactive visualization tools, such as DanteSearchVis, DanteExploreVis, BookOwnershipTracker, KURF2022, KURF2023, and KURF 2024.
As a historical driver of information exchange and dissemination, books change hands and locations over their lifetime. Unlike modern books with identification numbers and digital tracking systems, the task of tracking the historical trade of books relies on historians working with modern libraries (“Holding Institutions”) that have collections of these historical books to analyse material evidence (such as manuscript annotations, decorations, and bindings), documentary evidence, as well as bibliographic evidence.
The MEI dataset compiles this evidence for c.90,000 records from over 1,000 libraries worldwide; indubitably, it contains an overwhelming wealth of information about the movement of incunabula. Leveraging the dataset to reconstruct the provenance and circulation of historical books has wide-reaching applications for historical research, from testing hypotheses to identifying obscured patterns and surfacing new interpretations, offering significant potential to advance book history. However, the sheer volume and complexity of the book trade data presents challenges to book historians navigating the dataset alone.
Most libraries today consist of shards of earlier libraries, broken up over centuries for political, economic, or cultural reasons. A historian at the Oxford Bodleian Library who wants to reconstruct a historical collection and identify books formerly owned by a specific owner must undertake the herculean task of manually examining large volumes of provenance records (if they exist at all) to find these dispersed books. In the satellite database of MEI, Owners of Incunabula (OOI), which operates as the authority file for former owners, some 30,000 libraries are in the process of being reconstructed. Each name is linked to the MEI records of incunabula once owned by that person or institution. In MEI, the facet by Holding Institution automatically presents how the historical collection was dispersed, in which current holding institutions. However, the way in which the display of data is currently set up in MEI and OOI does not allow to easily present the historical collections held in each holding institution, let alone comparing them to highlight commonalities among current holding institutions. This was therefore the objective set by Prof. Dondi for the KURF 2026.
Working in tandem with the domain expert, Prof. Dondi, and with the guidance of Dr. Abdul-Rahman and Dr. Xing, Binuli and Jacelyne designed and developed a solution for this: ‘Six Degrees of Separation’, a two-part tool that enables the visual identification of what today’s libraries have in common in terms of historical collections.
Process
The project followed an iterative co-design and development process, with each weekly sprint ending in a review of the progress made and feedback from the domain expert. This allowed the product to be shaped and guided by the needs of its intended users while staying within technical constraints.
We began by clarifying the research problem and the tasks a historian or librarian might use the product for. What do the Bodleian Library of Oxford and Morgan Library of New York City have in common? This scenario defined the project’s central requirement: to transform large quantities of MEI provenance data into an interface that lets researchers compare modern library collections through their shared former owners.
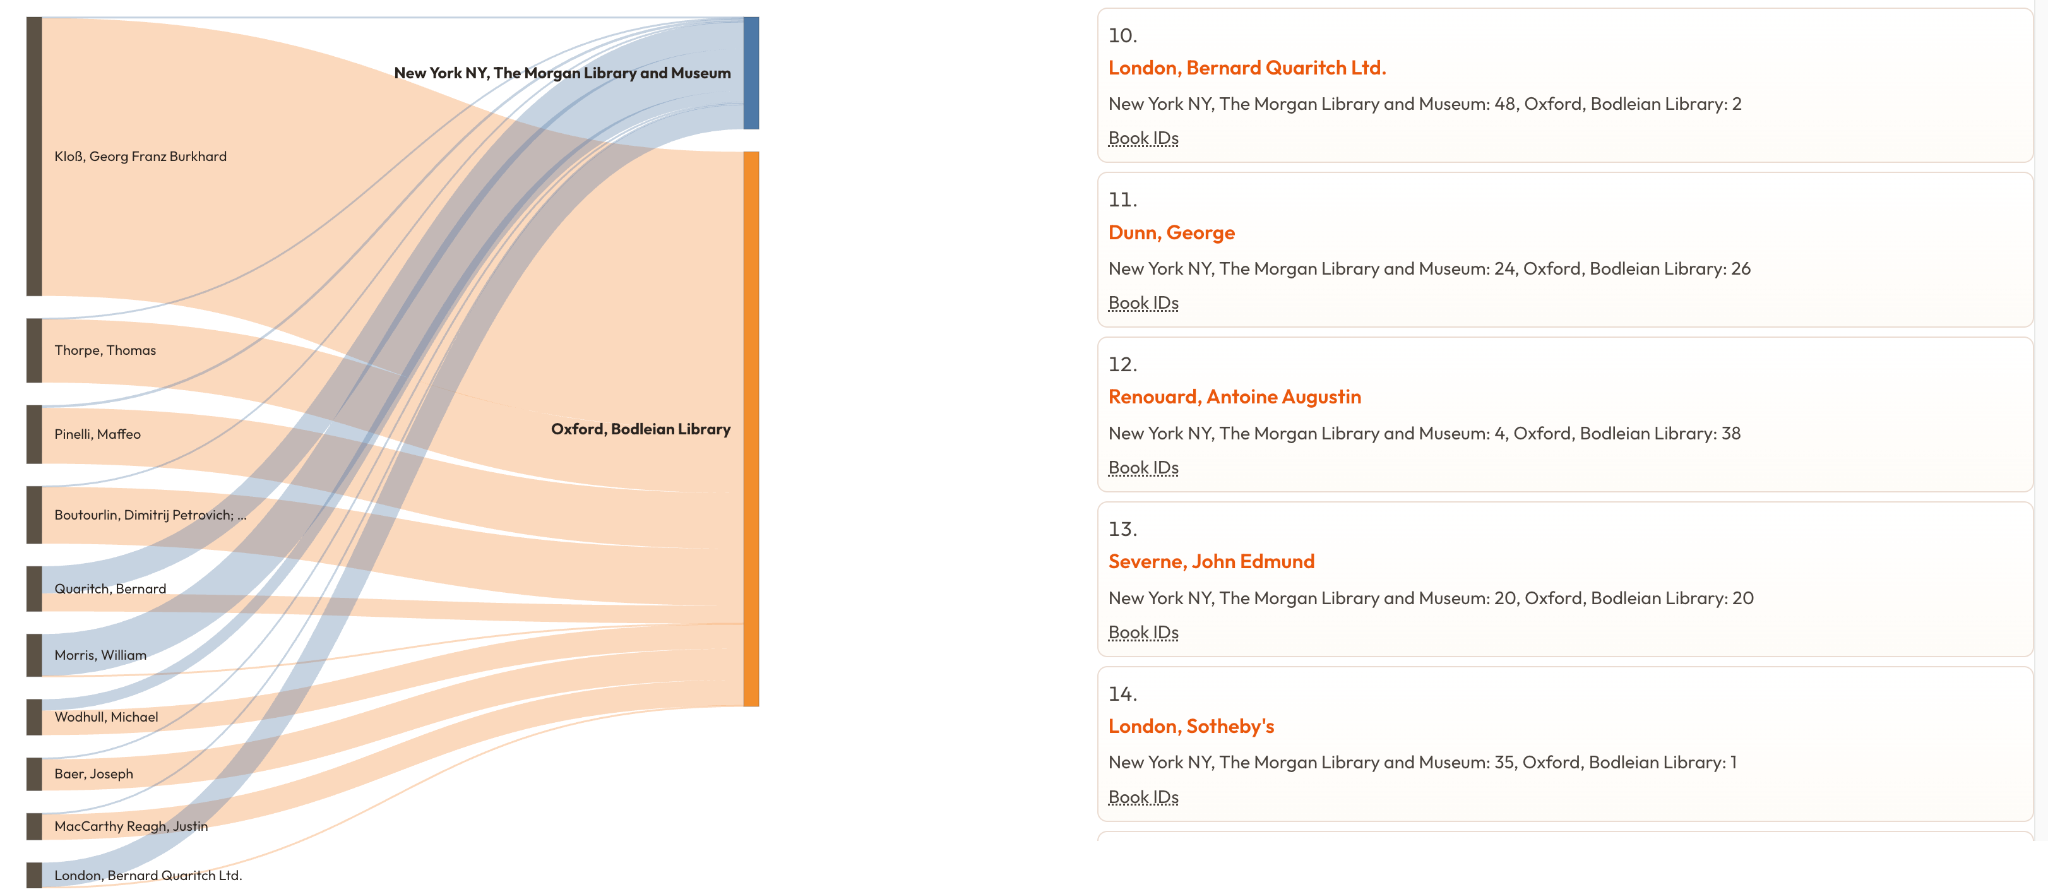
Historical collections shared between the Bodleian Library, Oxford and the Morgan Library, New York City.
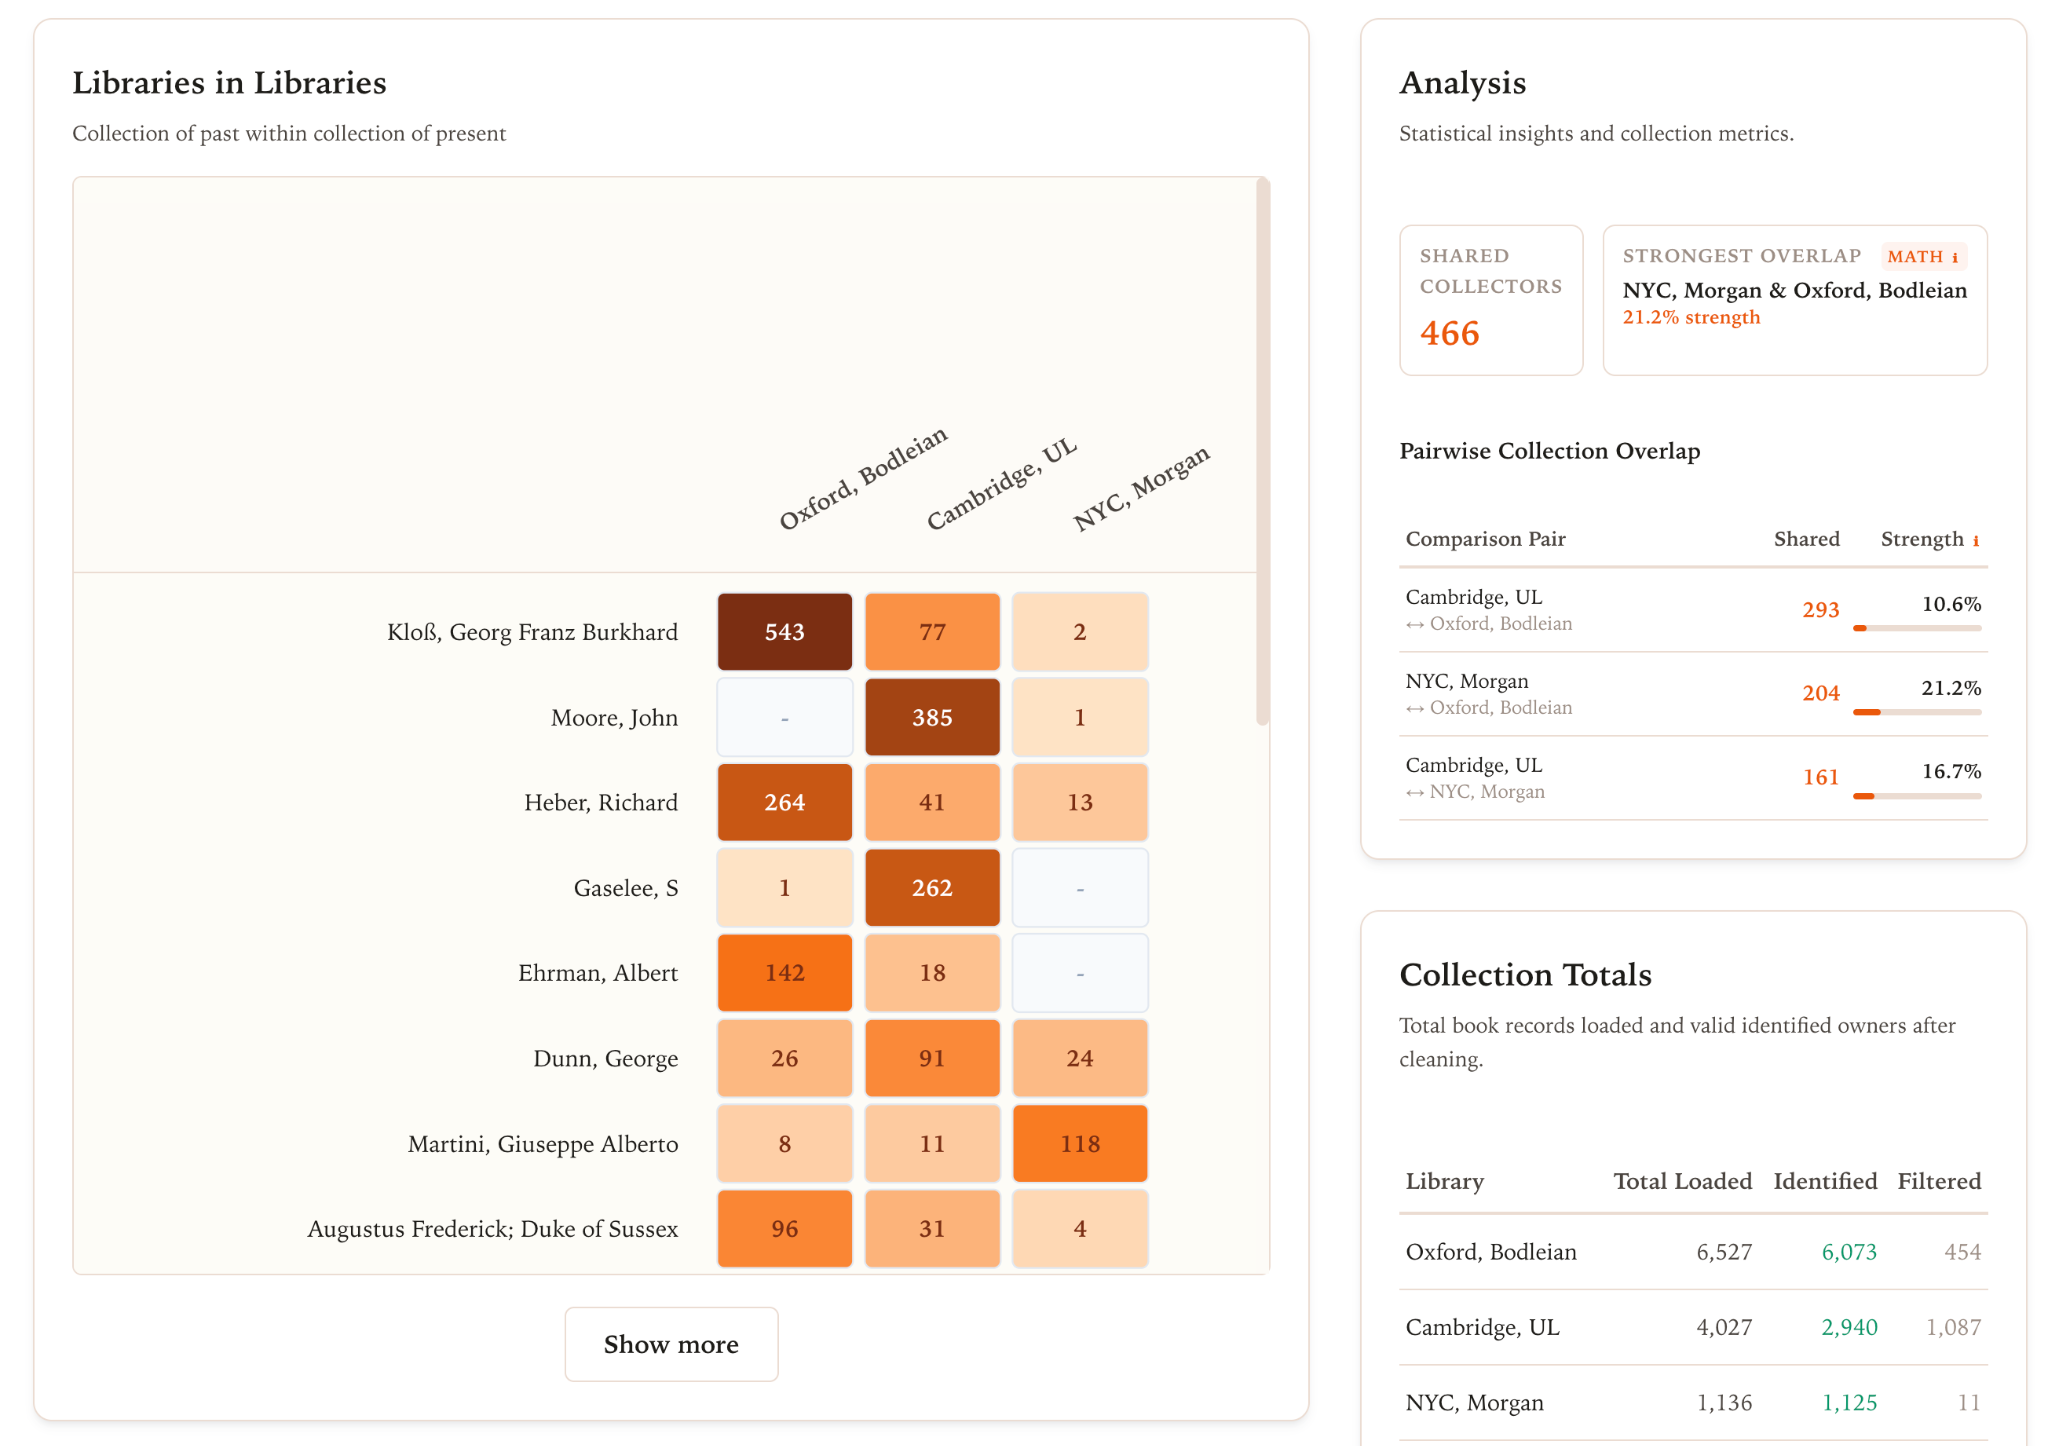
Historical collections shared among the Bodleian Library, Oxford, Cambridge University Library, and the Morgan Library, New York City.
The first task was to build an extract, transform, and load (ETL) pipeline. The extraction stage pulled records from the MEI API and kept important information like the book identifier, former owner name, owner identifier, and Holding Institution. The transformation stage sorted them into ranked provenance lists, grouped books by former owner, and counted distinct books. With the data transformed and structured, all that was left was to design visualizations and the interface.
This cycle of requirements, data processing, and visual representation repeated throughout the four weeks. Each sprint’s feedback set the next week’s priorities and grounded the implementation in real historian needs.
The first challenge was scale. Some Holding Institutions hold thousands of incunabula, and each book may have several provenance events. Building a library’s provenance profile means processing many records, and fetching them directly from the API was slow, especially when comparing several institutions at once.
The task was to balance flexibility with performance: researchers should be able to investigate any library in MEI and still get results in reasonable time. To address this, we developed two complementary approaches.
The first tool supports live comparison between two Holding Institutions. It retrieves records directly from the MEI API, allowing users to select from the wider range of holding institutions represented in the database.
The second tool was designed to compare several libraries. Because repeatedly retrieving large datasets from the API would make this type of analysis too slow, selected institutional datasets were pre-processed and cached. This reduced load times and made it practical to explore relationships between several large collections simultaneously.
The compromise kept the flexibility of live MEI data while supporting more demanding multi-library visualizations.
The second challenge arose in the transformation stage. MEI data are highly structured, but they come from either manual cataloguing or bulk imports, and they contain inconsistencies. Dates and other descriptive material sometimes appeared in name fields. Some owners were anonymous. In other cases, what looked like one historical person had several owner identifiers, so the same owner could appear multiple times in a provenance list and distort the counts.
The question was not just how to clean the data, but which kinds of cleaning preserved the truth without obscuring the final results. This is where consultation with domain experts was invaluable. Together, we decided to exclude anonymous entries because they could not contribute meaningfully to comparisons based on former-owner identity. We also removed the present Holding Institution from the provenance list because it commonly appears as the final owner in a book’s provenance sequence, while the tool aimed to investigate earlier ownership.
Names needed more caution. Aggressive normalization would have merged records that merely looked similar, risking the conflation of different people who shared a name. We therefore kept owner identifiers wherever they were reliable and applied name normalization conservatively.
This showed us that data cleaning in digital humanities is a delicate step that requires close collaboration across disciplines. Deciding whether two records describe the same person is a historical interpretation, and a mistake at this stage would ripple through every subsequent statistic and visualization, causing misrepresentations and inaccuracies.
With the data in comparable lists, we then had to decide how to present the relationships. We explored force-directed and circular link graphs, Sankey diagrams, and heatmaps.
Network graphs were attractive because they can show relationships between former owners and present-day libraries directly. Sankey diagrams gave an intuitive picture of how fragments of a historical collection are distributed across institutions. Both became illegible as the data grew. Large libraries produce long lists of former owners, and the large number of nodes and links made the graphs crowded and hard to read.
The final approach used different visualizations for different analytical tasks. For detailed comparisons between two libraries, Sankey-style representations and ranked provenance lists remained useful because researchers could focus on the most significant shared owners. Rather than displaying every possible former owner, the visualization could prioritize those associated with the largest numbers of books.
For multi-library comparisons, a heatmap proved more effective. The matrix format made it possible to compare degrees of commonality across several institutions without creating an excessive number of overlapping nodes or links. In later iterations, we further refined the heatmap by shortening institution names, ranking libraries by relevant measures, strengthening visual differentiation between values, and freezing headers so institutional labels remained visible while scrolling.1
The result was not a single visualization intended to solve every research problem, but a set of representations suited to different levels of comparison.
A further challenge was defining “commonality” mathematically. No established measure seems to capture how strongly two modern libraries are linked through their historical collections. Counting shared former owners is one indicator, but it ignores how many books each owner represents.
Consider two libraries that share twenty former owners, each represented by one book, and another pair that shares five owners, each represented by dozens of books. A simple owner count suggests the first pair is more closely connected. The book distribution suggests the opposite.
We explored several permutations and combinations of measures: shared owners as a proportion of the owners represented in a library, books belonging to shared owners as a proportion of the library’s total incunabula, an individual owner’s books as a proportion of a library’s holdings, weighted measures combining the proportion of shared owners with the proportion of books they represent, etc.
Each answers a different historical question. The proportion of shared owners shows how far two provenance profiles overlap. The proportion of books shows how substantial those shared collections are within each library. An individual owner’s share shows the weight of one historical collection within a present-day institution.
Rather than impose a single composite score as the definitive measure of similarity, we presented several complementary statistics, each with a clear explanation, so researchers can choose the one that fits their question. This decision reflected a broader principle that emerged throughout the internship. Historical relationships are difficult to reduce to a single number. A useful visual analytics system should support interpretation and insight through transparency.
Reflection
Each stage of the project was shaped through an iterative and collaborative process. By the final week, the tool had grown from a simple comparison of two Holding Institutions into an exploration of relationships among multiple libraries.
Binuli and Jacelyne are proud to have contributed to a tool that could support further provenance research. By making dispersed collections easier to compare, it may help researchers identify books that once belonged together, trace the dispersal of former libraries, and find relationships that manual inspection of individual records would rarely reveal. We hope it encourages collaboration between Holding Institutions by giving a library that sees substantial parts of a historical collection scattered across other institutions a reason to pursue shared research.
Of course, this tool is only as comprehensive as the quantity and quality of the MEI records, and another outcome of its creation is also that of facilitating quality control in the database.
Binuli and Jacelyne would like to thank the KURF program for this opportunity to delve into the world of libraries and Dr. Abdul-Rahman, Dr. Xing, and Prof. Dondi for their guidance throughout the process.
Notes
1 – To search the name of a library in the multiple-comparison page, the user needs to type the name of the “Institution Name” in the first section, for example ‘Oxford’. Then scroll down to the section at the bottom-left, titled “Institutions Matched”, and select the institution you would like to compare, for example ‘Oxford Bodleian Library’. Then repeat the process for other institutions; finally, select the button “Compare libraries”.
Related articles
by Markéta Kučerová and Vojtěch Šícha, Library of the Czech Academy of Sciences
Sep 24, 2026
by Konrad K. Szymański (Ossolineum National Library, Wrocław)
Sep 18, 2026

by Klāvs Zariņš, PhD, and Aija Taimiņa, Dr. philol., University of Latvia Library
Sep 08, 2026
by Caroline Duroselle-Melish, Angela Dressen and Attilio Bottegal, I Tatti, Harvard
Aug 31, 2026