The value of visualisation in improving data quality: Mapping MEI
by Andreas Walker, Data Conversion Group, and Cristina Dondi, CERL Secretary
Share this article
Material Evidence in Incunabula (MEI) was conceived and designed from the start with the objective of tracking the movement of books, from the time they were printed to the time they entered their current holding institution. This approach is bringing to light new historical evidence on early distribution networks, the effective use of books by individuals and institutions, and patterns in the formation and dispersal of library collections over time.
More often than not, a change in the ownership of a book also means a change in the book’s physical location. Either as single items or as a whole collection, books are sold, gifted or change hands by other means, and in doing so they move from one place to another. In MEI, every piece of provenance evidence is recorded in a separate block, which is tagged geographically and chronologically. The movement of a book over its 500 years is therefore represented in MEI records as a sequence of blocks of provenance, whereby the last provenance block corresponds to the current location. We store the geographical information in the form of identifiers from one of the major geographical databases on the Web, GeoNames.
Information of this sort lends itself to visualisations. In this blog post, we want to explore one such visualisation we created – a map of incunabula’s current locations according to MEI, the decisions that went into designing it and the effect it has had on the community.
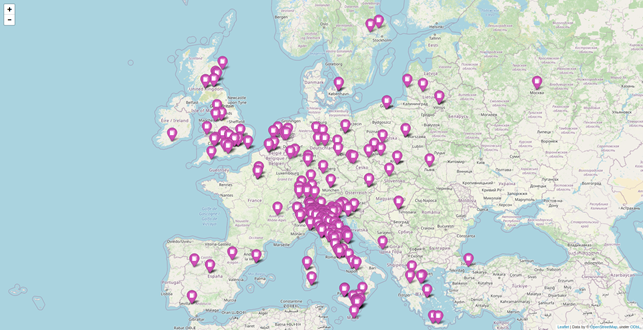
Figure 1: The MEI map, zoomed in on Europe
The first hurdle in creating this map was that of operationalising the concept we wanted to visualise – the current location of incunabula in the world. MEI contains two data fields that could be thought of as an expression of this concept: there is data.holdingInstitutionId, which contains the ID for the institution currently owning a book (from our own Holding Institution database), as well as the last provenance block of the record which should also reflect the current owner, and consequently coincide geographically with the holding institution. Both the records in the Holding Institution database and in the provenance blocks may hold a reference to GeoNames.
We made the decision to go with the provenance blocks for the creation of the map, for two reasons: first, because it makes the code more performant, avoiding a second database lookup for each record (that is, calling the Holding Institution database to look for the GeoNames reference). Second, because the resulting visualisation will tell us more about the data that are in MEI itself – whereas the Holding Institution database is shared with other databases in the CERL ecosystem and may deviate from the information held in MEI for this reason. The map is created by a Python script that queries the database and retrieves GeoNames identifiers from the last provenance block. It then requests the data for that identifier from GeoNames – which is available as RDF (Resource Description Framework), the standard format for linked open data, obtaining the place name, its latitude and longitude, and its type. Type information is important, because GeoNames holds information about all kinds of places – and not all of them are such that we would want to place them on a map. In cases, e.g., where the last provenance block simply points to “Northern Europe”, the respective record at GeoNames has coordinates somewhere off the coast of Norway – hopefully not the place where any incunable is currently located. For this reason, we decided only to place markers for places of ‘type P’, which in the GeoNames ontology is used to denote cities and villages.
The actual map is created using the Python library folium, which creates a static HTML document in which the JavaScript library leaflet.js is used for displaying an interactive map. This makes it easy to host the resulting map without any additional infrastructure – consisting of a single file, it could even be sent as an email attachment.
(We will be publishing a Jupyter Notebook for creating your own map in due course; at the moment the current script cuts some corners and uses non-public database features in order to increase its performance.)
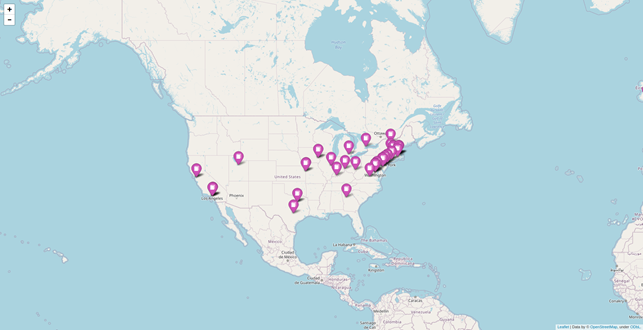
Figure 2: The MEI map, zoomed in on North America
Responses to the map from our community after it was announced on our mailing list and on Twitter were very enthusiastic. In addition to providing our editors with a good overview of the scope of MEI these days, it also prompted an engagement with their local knowledge, quickly spotting and bringing to our attention potential errors and omissions in the map.
What this interaction demonstrated is the ways in which data quality can benefit from visualisations: following up on each hint we received, we noted several records that had issues leading to their locations’ omission from the map. This included records where the current holding institution was not recorded as the final provenance block, as well as records where the final provenance block had a GeoNames identifier pointing to some administrative unit rather than an actual physical place (“P.PPL” = population is our preferred choice for GeoNames entities). These were filtered out for the reasons mentioned above, and changing them with identifiers to entities of the correct type would improve the coherence of the data in MEI – something not easily spotted otherwise. Only the accessible data visualisation, in combination with the highly specific knowledge of our editors who know which libraries should and should not be visible on the map, brought these cases to our attention.
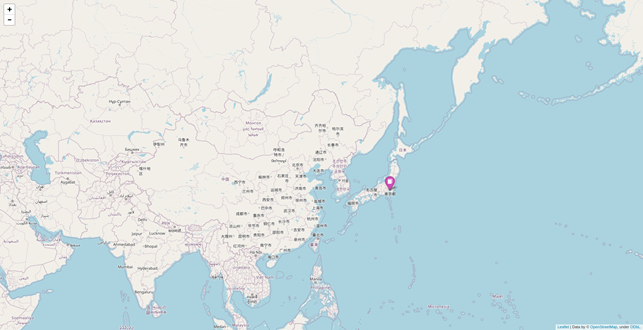
Figure 3: The MEI map, zoomed in on Asia
One question we were asked multiple times was whether it would be possible to publish a map that recorded the location of single institutions, rather than aggregating the locations at city level. While we would also be interested in this – and we can see how it would help institutions display their participation in this cooperative project, this is, as always, a matter which relates to the availability of this information in the underlying data. While we record GeoNames identifiers in our Holding Institution database, these too only point to the city level. More precise coordinates could be obtained for these institutions where the respective Wikidata item is recorded – such as in the entry for the State and University Library Göttingen. Unfortunately, we are lacking this information for many of the institutions in our database, and currently do not have the resources for completing it. In the absence of reliably recorded information on institutions’ location, any map generated would be partial at best.
This leads to a final point on the value of visualisations: the map also clearly highlights the many gaps still present in the data set. Incunabula are located all over the world, and MEI’s current 56,686 copies – although a respectable number – only describe a part of them. Looking at the geographical distribution of our records, we can also identify areas where we may have to increase our efforts in finding and describing collections together with their local owners.
Related articles
by Konrad K. Szymański (Ossolineum National Library, Wrocław)
November 9, 2026
by Caroline Duroselle-Melish, Angela Dressen and Attilio Bottegal, I Tatti, Harvard
November 9, 2026